A knotted pipeline
Data-driven systems and inequalities in health and social care
1 November 2022
Reading time: 111 minutes
Executive summary
Every day, the health and social system across the UK seeks to provide medical support, care and treatment to tens of millions of UK residents. This system comprises a complex network of devolved public health and national health bodies, such as NHS England and Public Health Scotland, and includes partnerships with private providers of health technologies, hardware and digital services.
Throughout its history, a major challenge the UK health and social care system has faced is addressing health inequalities: avoidable, unfair and systematic differences in health outcomes that exist between different demographics.1
It remains a reality that health and wellbeing in the UK are experienced differently across different socioeconomic, ethnic, geographic and age groups.2 This was evidenced repeatedly during the COVID-19 pandemic, which showed how data-driven systems promise3 – and at times demonstrably provide – better health and wellbeing outcomes. But they also risk exacerbating existing inequalities in health, which can lead to some members of society experiencing harm and losing out on the benefits of health technologies.
Some of the ways these inequalities arise are well known, such as the lack of representativeness of – and the bias in – data used in analytics and AI, and through differential access to health technology. But other ways are less obvious.
As data-driven systems become the new norm in the delivery of health and social care, it is vital to fully understand why and how complex data-driven systems can sometimes lead to inequitable outcomes.
Through the period of the COVID-19 pandemic, the adoption of data-driven systems has accelerated, influencing resource allocation and public health measures. New technologies range from real-time public health updates, like the NHS-developed COVID-19 dashboard that provided dynamic data about infections and vaccine coverage in the UK, to novel forms of healthcare delivery, like the use of Dr Doctor to manage appointments for vaccine distribution.4
Data-driven systems can both alleviate and entrench inequalities – but the latter may be more likely when people’s needs are sidelined in service of an overreliance on data. Despite the positive contribution that some data-driven systems have made to the COVID-19 response, there remains very little evidence about the ways in which they may be interacting with, and impacting on, longer term socioeconomic inequalities in health.
This report is not intended as a critique of the many concerted efforts to address impacts from the COVID-19 pandemic, or of measures that were deployed in response to a rapidly changing public health emergency. Rather, the evidence in this report is intended to inform understanding of how to use data-driven technologies to achieve equity in future outcomes.
Scope
The goal of this report is to describe the complex interplay between data and inequalities in the health and social care system across the UK. Acknowledging the potential for data-driven technologies to improve health and social care outcomes, this report scrutinises the ‘pipelines’ of data that power health technologies, identifying trends, approaches or limitations in data and data use that might undermine the beneficial outcomes sought.
While the evidence in this report comes from examples of data-driven systems in the context of the COVID-19 pandemic, its findings are relevant to the ongoing efforts to ensure that data-driven technologies deliver equal benefits for everyone. Indeed, careful consideration of the issues raised in this report will be crucial for ensuring that the increased significance of data-driven systems in the health and social care system across the UK do not compound existing inequalities.
In the research that underpins this report, we examined the mechanisms that impact on health and social inequalities as being sociotechnical in nature, meaning that they involved both people and their use of technology and infrastructures, rather than just the technology or infrastructure alone.
The term ‘data-driven systems’ is used to refer to technologies like data dashboards and algorithms, and the infrastructure they rely on to store, process and use data. But data-driven systems are more than just the technology: they also include the people who develop, design and use these technologies – engineers, product teams, clinicians, hospital administration staff and others – and the insights they produce.
At the top level, this report finds that addressing health inequalities in data-driven systems will require those involved in designing, developing, commissioning and using data and data-driven systems across the health and social care system to take a people-centred approach to data. This means they must always consider the context in which data is collected, used and understood, and consider who is involved in these decisions.
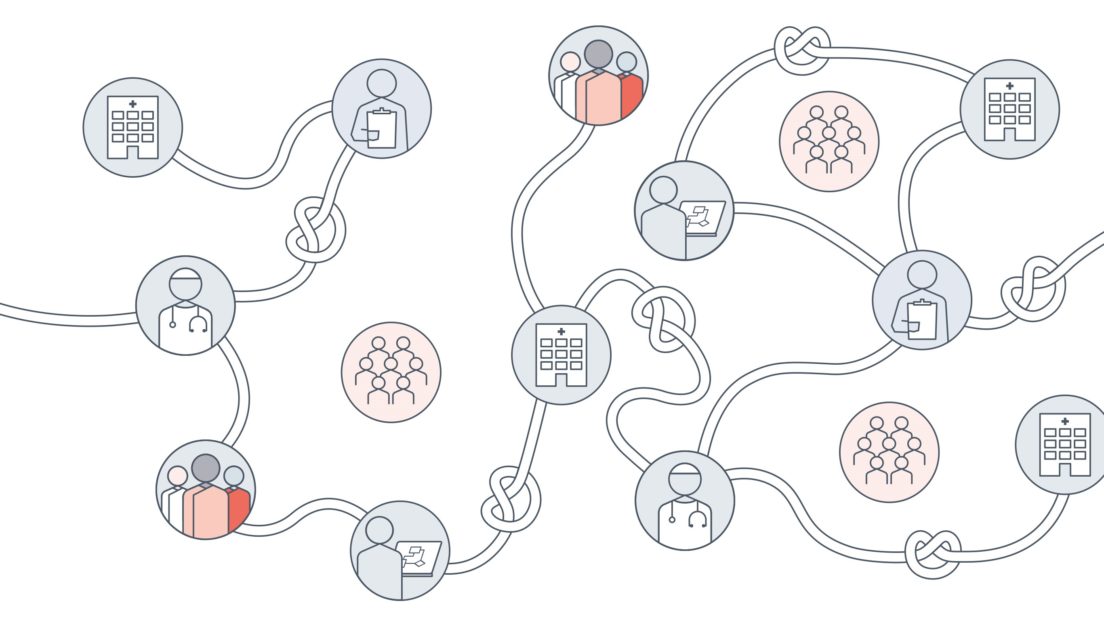
The pipeline refers to the sourcing, flow, curation and sharing of data in a health and social care system between government departments, local authorities, clinicians, public health officials and other actors, including private organisations. Data-driven systems rely on this pipeline but are often hampered by what can be seen as ‘knots,’ which disrupt how well data-driven systems work in reality.
‘Really it feels very like data plumbing: there’s lots of pipelines and repositories […] I mean it feels like we built more spaghetti, a little bit […] You know it’s quite challenging, when you want to validate the data quality stuff, I think it took somebody two weeks to understand the flows of the day to [sign] them off.’
Product owner
Understanding data-driven inequalities as knots in a pipeline
The UK Government’s Data Saves Lives paper emphasises the importance of data-driven technologies in transforming health and social care in England, including a more seamless flow of information between different health and social care organisations.5
To be ‘successful,’ a data-driven system would rely on a flow of information from source to design and deployment that is free from unnecessary obstacles and is able to improve health and social care for all.
This report contends that the ‘smooth’ data pipeline is a hypothetical ideal that does not reflect the complexity and imperfection of reality. If data is to continue to be useful for healthcare decision-making, now is the time to recognise that data-driven technologies in health rely on a complex ‘knotted pipeline’ of information.6
Technological solutions that do not consider the significance of individual decision-making – from data collection, data quality, curation and standardisation methods, to design and deployment of interventions – will increase local, national and global inequalities.7
The role of private and public partnerships will need to be considered, so that they are conducted in ways that engage diverse communities and enable open communication between local and national bodies, even if this is contrary to what the technology providers assume is the right direction.
In this report, we show that when conversations are not aligned, data-driven systems limit the ability of practitioners to use data to address inequalities.
People working within data-driven systems must recognise and respond to the knots in the pipeline in order to use data effectively, see its limitations, and enact the infrastructural and cultural changes needed to address inequalities.
This report sets out to make visible the complex data pipelines and decisions that interact to create downstream impacts on people’s lives.
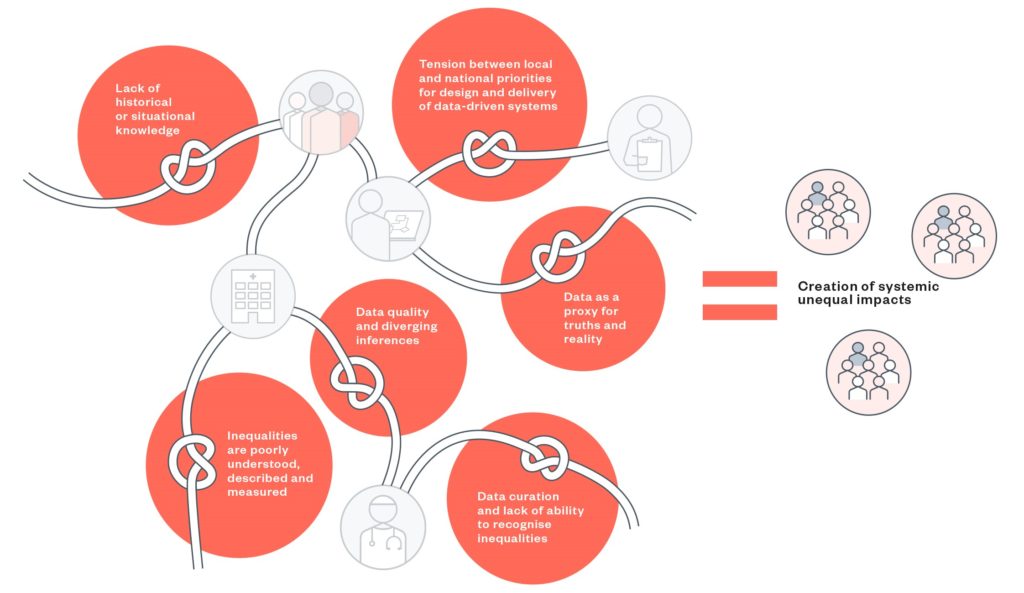
The knots in the pipeline – a summary
Inequalities are poorly understood, described and measured
- This knot describes how people involved in building data-driven systems may have a poor understanding of health inequalities, and that there is a general lack of clarity around whose responsibility it is to consider bias and inequality in system design.
Tension between local and national priorities for design and delivery of data-driven systems
- This knot looks at how differing approaches to the design and delivery of data-driven systems are rooted in political priorities and power dynamics. This may compromise the quality of insights by overlooking local needs and knowledge in service of national goals, where those local insights may be vital for flagging and mitigating inequalities.
Data quality and diverging inferences
- This knot addresses the fundamental issue of data quality – that having poor quality or incomplete data can cause unequal outcomes in downstream uses. It covers the challenge with time-delayed or out-of-date data, and the fact that not everyone is well represented in datasets used to make decisions about health and social care.
Data curation and lack of ability to recognise inequalities
- This knot considers the pitfalls of data curation – when it is done in a top-down way that flattens out important nuance, and when coding and categorisation is done poorly. There is a tension between easily disseminated and digestible data visualisations, and the need for disaggregated data for teams to extract meaningful insights around inequalities or notice where there are gaps.
Data as a proxy for truths and reality
- This knot looks at what happens when people trust too much in aggregated datasets and visualisations to provide an accurate picture of reality. It suggests that while proxy data and combining different datasets can provide some context, it is still important to interrogate the ways in which lived experiences might differ from what’s being presented, and how interventions should be adjusted to achieve equitable outcomes.
Lack of historical or situational knowledge
- This knot highlights the importance of multidisciplinary knowledge in proper data analysis. Data that is devoid of local and historical context can lead to misinterpretation and poorly targeted interventions, with some demographics being overlooked or incorrectly categorised.
Creation of systemic unequal impacts
This section takes an overarching view of the knotted pipeline, and is crucial to understanding how the work done across different parts of the pipeline come together to have observable impacts for health inequalities.
It describes some of the ways this has happened over the pandemic, from marginalised communities being excluded from services targeted through algorithmic assessments, to the use of genomics data to explain health outcomes while obscuring important historical and social context. This section reminds us that, although certain knots may be more relevant for some than others, it is important to consider the pipeline as a whole to see how addressing these knots can help mitigate inequalities experiences across health and social care in the UK.
How to read this report
This report explores and describes a system-based approach to the complex question of how inequalities can be produced by data-driven healthcare systems. It does not make direct recommendations but instead, invites readers to reflect on their own capacities and roles in any healthcare data-driven system and the decisions they make daily that relate to that system or its use of data.
The report identifies barriers, or ‘knots’ in the system, which combine theoretical analysis and abstract concepts with real practices and challenges.
The knots have multiple relationships to each other, so there is no single start or end point, and no definitive order of severity or importance. We invite you to move through the pipeline to see how the individual knots feed into the overall impact on inequalities, and work your way through the knots to the end point, which describes the impact of each of the knots on the entire health and social care system.
Readers with a role in understanding and improving the health and social care system could start with the following:
If you are a commissioner of products or systems, working at the local or national level, inequalities are poorly understood.
- This knot looks at the overall issue of definitions and approaches to deploying data-driven systems and provides a way to think about how data-driven systems could be impacting, and be impacted by, the range and scale of inequalities
If you are a policymaker, making decisions about health priorities for people, places or populations,8 start with the knot describing the misalignment of local and national approaches to the delivery of systems. You can also start from this knot as a commissioner.
- This knot addresses concerns about conflicting priorities between local and national bodies – enabling flexibility for local needs while inputting into national goals.
If you are responsible for data collection practices, coding, software and standards-setting, and analysis, as a system engineer or product designer (including as a private contractor) begin with the knot on data curation.
- In this knot, you will read about how cleaning up data can enhance or impinge on the ability of data-driven system insights to both produce better outcomes and also reduce inequalities.
Similarly, irrespective of being publicly or privately commissioned, if you work as a product or team lead collecting or linking data, or as a researcher or data analyst, then the knot that describes data quality will be of interest.
This knot describes specific data quality issues related to how data is collected, the sources of data and how the interpretation of variables can lead to different inferences, thereby creating downstream inequalities if the assumptions in those data and inferences are not addressed.
Where your role requires you to create or analyse data systems, commission services or recommend interventions, the knots on what happens when we take ‘data as proxies for truths and realities’ and ‘the lack of historical or situational knowledge’ will be of interest. These knots apply to everyone who interacts with data-driven systems, and can be seen as a way of thinking about the problem and drawing links between seemingly abstract ideas to quantifiable or visible outcomes.
- These knots include the concerns around mis-profiling or missing individuals in the data, due to the ways data collection has so far been organised, and how such oversights might leave some communities experiencing worse outcomes than others.
Finally, the section that describes the creation of systemic unequal impacts will be of interest to everyone, as this highlights all the ways in which individual knots align and interact to create and sustain inequalities in health.
As you start from a particular knot, we recommend moving through the remaining knots, reflecting on how one knot feeds into the next, and how your own daily work can culminate into much larger effects on communities.
Introduction and context
Data-driven systems are becoming ever more central to health and social care in the UK, and have the power to reduce or compound health inequalities in new ways.
This trend has accelerated during COVID-19, the first pandemic of the ‘algorithmic age’, as solutions to the global health crisis incorporated data-driven approaches at scale, bringing new opportunities and risks.
A focus on data-driven systems in health has continued beyond the pandemic response, with ‘digitally enabled healthcare’ a stated priority, and ‘better use of data’ touted as central to improving population health and tackling unequal outcomes.5
Lessons from COVID-19
The data-driven technologies adopted and accelerated over the course of the pandemic included predictive analytics to model the spread of the virus, apps to track and trace contacts or monitor movement, and algorithmic approaches to staging vaccine distribution. Data sharing also changed in response to the pandemic, as seen in prioritisation schemes10 for those at increased risk of infection or illness,11 and the increase in the use of AI12 to manage patient triage and diagnoses.
All of these activities relied on data and the ability to bring sometimes disparate data sources into an analysable whole. This involved complex systems of people – clinicians, public health officials, researchers and developers of healthcare technologies, among others – who collected, cleaned, analysed and drew insights from this data. It also relied on data infrastructure, such as Trusted Research Environments (TREs)13 or data dashboards that collated data for sharing.
Social and health inequalities have been a prominent theme throughout the pandemic. Ethnic and geographic differences have been pronounced in COVID-19 mortality rates: the Health Foundation’s 2021 COVID-19 impact inquiry established that those younger than 65 in the poorest 10% of areas in England were almost four times more likely to die from COVID-19 than those in the richest.14 In the first year of the pandemic, Black and South Asian people were twice as likely to die of COVID-19 than white people, taking into account differences in age and sex.15
Did the very public health measures that were used to manage the pandemic result in worse health outcomes for some members of society? Inequalities in health are not new, but the COVID-19 pandemic and some measures taken to mitigate it have led to creation of new vulnerabilities in society, leading to the exacerbation of unequal outcomes in health and social care, and setting the stage for future challenges.
Data-driven systems and negative outcomes in health and social care
There is a high chance that the historic and existing inequalities that arise through data-driven systems are going to worsen with the proliferation of new technologies,16 and there is a need to further understand the intersectional ways in which inequalities are experienced in different contexts.
It is at the nexus of factors such as digital connectivity as a new determinant of health,17 the increasing turn to digital health activities through video and other remote consultations,18 and data-driven strategies in health and social care settings5 that concerns around inequalities can be addressed. To make sense of this, it is important to clarify how top-down health and care system structures interact with bottom-up societal mechanisms.
The entanglement of data and data-driven systems and inequalities is underpinned, in part, by how we collect data. As the UK Statistics Authority reported, there is important work to be done to collect better data in ways that represent everyone in society.20 Beyond the pandemic, interventions stemming from this collection of data will continue.
This research is designed to be useful to commissioners, policymakers, technology designers and developers, researchers and data analysts working with data-driven systems in health and social care. Each of the knots highlights sections of practice and decision-making that should prompt those in positions of power and influence to consider how best to commission and design systems that produce more equitable outcomes.
A partnership to investigate data-driven inequalities
The Ada Lovelace Institute and the Health Foundation have been working in partnership21 to explore how the accelerated adoption of data-driven technologies and systems during the pandemic may have affected inequalities, and the ramifications of this for the future of healthcare – beyond the pandemic. The aims of the partnership have been:
- To develop the evidence base around the interaction between data-driven systems and inequalities in health.
- To build a shared understanding of what action is needed to reduce inequalities in health, including how to design data-driven systems in ways that can reduce inequalities and improve health outcomes.
According to early pandemic research from the Health Foundation, factors such as being in poverty influenced one’s health status to the extent that ‘people in the bottom 40% of the income distribution are almost twice as likely to report poor health than those in the top 20%.’22 The research concluded that some interventions deployed to manage the pandemic would mean a greater burden on health for those in those lower income groups.
Evidence from Public Health England showed that people from minority communities were also disproportionately being impacted by COVID-19,23 while those who were at the frontline of health service provision also faced greater risk of adverse health outcomes.24
With the many ways that inequalities can be explored, the challenge is to show how contextual factors give rise to intersectional inequalities that lead to particular outcomes.
The Ada Lovelace Institute’s digital attitudes survey – the first activity of the partnership, conducted between January and February 2021 – highlighted further causes of inequalities that come not only from health datasets, but from the ability to participate in new health technologies.25
Results showed that, as not everyone was sufficiently digitally connected, comfortable with or able to use digital technologies, the deployment of these technologies was creating a digital divide observable through several factors. For instance, those on lower incomes (defined as under £20,000/year) were less likely to participate in new health technologies, were less likely to participate in new health technologies, supporting the conclusions made by the Health Foundation on the impact of poverty and adverse health outcomes.
In Ada’s Data divide report, it emerged that those who were on lower incomes were also very likely to be at higher risk of contracting COVID-19, while those who self-identified as being from Black, Asian and other minority ethnic backgrounds were likely to use contact tracing, symptom tracking or mental wellbeing apps at a lower frequency than those self-identifying as white.
The partnership has undertaken research across three broad workstreams (a landscape review, public engagement through lived experience research and a case study exploring a particular data-driven technology), all looking at data-driven systems and potential impacts on inequalities in multifaceted ways.
The objectives and findings of this landscape review form only one piece of evidence, to be read with upcoming outputs from the other workstreams.
The landscape review aimed to map the mechanisms by which data-driven systems impact and interact with social and health inequalities and was informed by the following objectives:
- To describe the mechanisms through which pandemic data-driven systems influenced existing health and social inequalities.
- To help develop future recommendations that could influence the design and deployment of more equitable systems.
Evidence synthesis
The evidence of increasing inequality within patient and population groups during the pandemic – despite the benefits of data-driven insights – produced a real challenge to routine uses of data.
As systems are designed and built, it can be difficult to recognise how existing biases and assumptions that may negatively impact communities are embedded into routine decisions about what data to use and how to use it. In fact, data-driven systems that were deployed during the pandemic were not always built or deployed with societal difference (e.g. income and deprivation, access to family or community support or digital connection) in mind.
This is not to say that developers of data-driven technologies have not given thought to addressing societal differences, but the way that information has been used has sometimes created more disadvantage and inequality, if not between individuals, then between geographical areas. To describe inequalities and (specifically) any negative impacts emerging from data-driven systems, we needed to ask whether and how:
- inequalities were defined and then measured in the use of data-driven systems
- rapid response efforts in the pandemic inadvertently led to new or increased inequalities
- using certain data (e.g. health and/or social care data), and data practices (such as standardisation of categories at local or national levels) have affected inequalities.
Responding to these questions helped us to understand how inequalities were mitigated or perpetuated through data and technologies.
A complex health system
Based on desk research and stakeholder interviews, we describe data-driven systems in health and social care as relying on a complex ‘knotted pipeline,’ whereby the knots are pinch points that must be addressed in order for data-driven systems to work without perpetuating inequalities.
We highlight three key issues which show the complexity of the health and social care system across the UK, how the knots in the pipeline come to be, and why it can be difficult to draw clear or linear links between the use of a data-driven technology and an impact on inequalities.
- There are numerous data flows between different players in the health and social care system These impact on:
- categorisations and coding of data, where there is often a lack of universal meaning or approaches to those codification
- data owners, who often find themselves working across multiple systems with unclear responsibilities relating to the ownership of their data and roles within the broader data-driven ecosystem
- who designates and takes responsibility for the function of the health and social care system’s numerous tasks. This makes it difficult to see how different decisions impact the overall function of a data-driven system, and can result in people duplicating decisions, or assuming someone else is responsible for those decisions.
- The ability of a data-driven system to inform health interventions without exacerbating inequalities, and ideally even to address those inequalities, depends on decisions about how data is used. This can be seen through:
- Data transfers and transformations – where decisions about whether data analysed at the local level needs to be ‘cleaned up’ for it to be shared and usable on a national scale. In transforming data, or standardising it, some local context vital to understanding inequalities may be lost.
- The type of analytic platforms used – in responding to the pandemic at pace, it was observed that analyses done on already existing but inflexible software and applications meant that it was difficult or impossible to adapt the data to reflect emerging concerns. Insights can only be derived from what is available. On the other hand, if analytic capabilities are flexible and build from the ground up (with local data, for example) then they may be more likely to adapt to emerging needs.
- Data pipelines have numerous pinch points, which we conceive as ‘knots’, where data does not, in fact, flow how it was intended or envisioned to. These appear in many of the infrastructures within the health and social care system.
- When a data-driven system relies on data access, the interoperability of data systems becomes crucial. This means that, while keeping to data protection and information governance good practice, those analysing data must be able to do so across multiple systems. Interoperability can reduce the need to standardise in a top-down way (which risks losing nuance in the data – important for recognising inequalities). But that still depends on a higher-level universal understanding of what different data categories and variables mean, so that detailed datasets can be compared, even when their manner of collection differs.
- Counter to narratives around the objectivity, efficiency and interoperability of data, these knots lead to inefficiencies, biases and inconsistencies in data practices, with potential downstream impacts on health and wellbeing inequalities. The result is a situation where the promises of data-driven systems are at odds with reality.
Failures to address the points above hamper the ability to prioritise and deploy data-driven technologies without harming communities or individuals.
We acknowledge that working with the metaphor of data as ‘flows’ through a system has limitations,26 when the reality is that the flows occur in a constant feedback looping mechanism.
Case-studies
Following are descriptions of six data-driven systems that formed an important part of the evidence base for this research. The critique of these systems underpins the discussions of the knots, including of diversity of data, missing data quality, incomplete data sets, selective deployment or uptake of services, lack of contextual information or use of proxy data to build the systems or generate insights.
As the pandemic evolved, available information about the specific technologies changed, so here we present only overviews of these technologies, starting each with how we categorised them at the start of the research in the summer of 2021.
OpenSAFELY
A novel approach to establishing a Trusted Research Environment (TRE) to enable analysis of NHS patient records. It was built in direct response to COVID-19 as a technology platform that enabled millions of data points to be rapidly analysed to understand the evolution of the pandemic and health-related outcomes. It has since been used for near-real-time rapid analysis of health records, including analysis of poor outcomes from COVID-19 by ethnicity or by existing health conditions. These analyses have been used to influence the response to the coronavirus pandemic, for example supporting decisions about vaccine prioritisation. It enables research to be translated into policy and practice, and as of the start of July 2022, claimed a coverage of 58 million NHS patient records.27
Genomics England and GenOMICC
Genomics England was an existing platform set up to analyse 100,000 genomes as part of the UK’s genomic pathway into the NHS. As part of the pandemic response, Genomics England accelerated its research by linking existing genomic and health data from UK Biobank and their related NHS patient records to conduct genomic analyses for COVID-specific research. This research also included recruiting around 35,000 people variously affected by COVID-19 and related analyses with those who did not have the virus.28 The results from the research were used to inform treatment and interventions, and to predict which patients were likely to become seriously ill.29 It is an example of another use of a TRE that was accelerated for research and clinical purposes.
NHS Digital and Public Health England – COVID-19 Dashboards and Early Warning Systems
These dashboards were focused on the production of near real-time data flows, collating and mapping across different data points to produce views of vaccine coverage and COVID-19 infections by different regions and demographics. This influenced insights and interventions, notably the R-number, vaccine rollouts and national and local lockdowns; but was also used to predict and monitor potential spread.30 Both dashboards predominantly showed data across England, as other devolved nations had their own coverage.
Q-Covid Algorithm and the Shielded Patient List (SPL)
This was a use of large-scale data analysis, bringing in insights from research on patient records, created using specific methodologies and algorithms to identify patients at high risk of being ill from COVID-19. The SPL ran from March 2020 to September 2021 and was created by NHS Digital (in England).31 It influenced initial guidance for certain people to stay at home. Information was shared with various organisations such as local authorities, DHSC and those providing mental health services. In time, this data was shared with the University of Oxford, who created and updated the clinical tool to create a risk-prediction tool called QCovid. This became a clinical decision-making tool that was deployed in England via NHS Digital and influenced national policy on shielding. Both these interventions were built using various types of data.32
Dr Doctor
The company’s innovative data-driven technology on scheduled appointments was one of the winners of Round 1 of AI in Health and Care Awards in September 2020.33 It currently acts as private industry AI-based tool selectively used by different NHS Trusts for patient management including bed and surgery waiting lists and uses, in part, app-based patient-level data that allows direct communication between the hospital and the patient. Dr Doctor’s technologies have been used to manage local vaccinations and claims to predict who is likely to attend appointments in the future,34 providing the ability to intervene for specific demographic populations.
Babylon Health – COVID-19 Care Assistant, Ask A&E and GP at Hand
Babylon Health35 was a pre-pandemic, digital-first private and NHS healthcare provider, whose remit accelerated and expanded in response to COVID-19. It provided digital triage services (Ask A&E) to support triage into some NHS Trusts,36 COVID-specific guidance37 and increasingly used AI tools in the provision of its systems. Babylon Health’s technologies have been assessed and evaluated by different authorities and – as with Dr Doctor – there have been concerns raised around selective data coverage and uptake, which may influence who benefits from those technologies.
Exploring the knots
The metaphor of a knotted pipeline is intended to show the difference between the imagined ideal of a data-driven system and the reality on the ground.
The knotted pipeline makes visible the messy inner workings of the data pipeline. This includes decisions on which data, practitioners, priorities and metrics of success also ‘come in’ at various points in the pipeline. These decisions matter because inequalities in health and care arise when those interactions do not start with an approach that embeds or builds equity by design.
This paper describes these knots as pinch points that prevent data-driven systems from working as well as they should, which helps us explore their interaction with health and social outcomes.
It does not provide any explicit in-depth critique of issues within data collection, data curation or data availability itself, but highlights how decisions around those issues interact while a data-driven system is being designed or deployed, to create potential negative outcomes. Organisations such as the UK Statistics Authority,38 the Royal Society,39 and the National Data Guardian’s office40 have covered many aspects of good data use, including on data collection, analysis and transparency. This report adds to those analyses.
Figure 1: The knotted pipeline
This review is a desk-based scoping based on publicly available documents about data-driven systems in health and social care, with additional information shared by technology organisations, supplemented by stakeholder interviews. The research was conducted in two concurrent steps – firstly, a document analysis and then discussion with stakeholders (see: Methodology).
Throughout the review, we use direct and paraphrased quotations from our stakeholder interviews, which spanned roles across public health, data analytics, business intelligence, research, digital product development, NHS commissioning, local councils and parliament.
Inequalities are poorly understood, described and measured
People involved in building data-driven systems may have a poor understanding of health inequalities, which is compounded by a lack of clarity on whose responsibility it is to consider bias and inequalities when designing these systems.
Although most were aware of inequalities in data-driven systems, they were not usually able to articulate either what they are, or their approaches to ensuring people do not experience further inequalities. This was apparent in the stakeholder interviews: many acknowledged the existence of inequalities in data-driven systems, but noted that in responding to the pandemic, these were not usually the driving reason or focus for deploying or adopting data-driven interventions.
Various limitations arose relating to the complexity of embedding inequalities in the design of data-driven systems. One issue raised by stakeholders was that decisions about whether inequalities had to be regarded as clinical safety concerns – and then how those concerns could feed into interventions – were not yet routinely embedded.
Stakeholders that saw the need to have inequalities as part of the safety design of technologies encountered barriers such as technology manufacturers and deployers pushing instead for risk assessments that were not informed by an equity outcome.
These kinds of factors can make it difficult to measure how data-driven systems may mitigate or exacerbate inequalities, as relevant metrics aren’t built in.
For NHS Digital’s COVID-19 Dashboard, one stakeholder highlighted the multiple dimensions to inequalities beyond ethnicity and suggested that some ways of ensuring data-driven systems did not engender bias was by bringing data analysts and clinical standards together in the design of such tools. An additional measure to mitigate biases or inequalities would be to design systems as use cases, so that insights could be embedded in the process. Having the team reflect the populations the data comes from was seen as another potential approach to minimising adverse consequences of data-driven systems..
A similar sentiment was echoed by the stakeholder working in a private digital health company, who suggested that data-driven technologies should have diversity and equity considerations included as part of the safety standards of the products themselves. They cited updates to medical device guidance,41 where those designing and deploying tools were reminded to ensure their tools worked for the populations they were looking after. There also appeared to be a general diffusion of responsibilities for thinking about impacts on inequalities. For instance, on one digital product team this responsibility fell in practice to the commissioners, but was not codified in processes. This meant that unless individual
commissioners happened to ask certain questions, concerns around bias and inequality may not be considered and designed for.
It was clear that despite this, the team did recognise potential tensions around having those conversations across different bodies including the NHS, for example when considering how to preserve the privacy of individuals whose data was being analysed.
‘The expert on UK specific health equalities issues is the NHS and I think it would be unhealthy for [us] to sort of be dictating in a very assertive way exactly what the NHS was doing with the most sensitive components of their own data, which is not to say that I mean one of the things we do is we make my team and other data ethics specialists and lawyers and philosophers here available for consultation…to engage in conversations like you know, if you were to do this, how would we go about it?
‘What’s the most ‘low lift’ way we can do this incredibly important analysis? We’ve made the underlying functionality readily available in the software. But, as you’ve correctly outlined, there is a real tension in this. Well, we think you should do it that way, but it’s your software. I mean, it’s your account, it’s your data, you’re managing it, you’re responsible for the compliance. You’re responsible for the transparency in the privacy announcements and all of that, and it becomes difficult for us to say, you have to process your most sensitive data in this way.’
Digital product team
From the perspective of NHS developers, as well as commercial organisations working in this space, an understanding of inequalities was not explicit. The need to respond to the pandemic through rapid, in-the-moment interventions meant several respondents acknowledged that they did not consider inequalities in the various decisions about how to gather or deploy data-driven insights.
When inequalities were considered, they were broad-brush and included ‘regular’ issues such as language, ethnicity and sometimes accessibility. Usually this was in relation to making a system better, or to address a particular need (e.g. vaccine uptake, coronavirus in an area, usability of information).
‘How is that being embedded in those systems and how are you making sure you’re not building new biases into the system as a whole? That’s a super complicated question, and I think that’s where you need experts and research, and I think probably the worst world to be in is where you got the wrong people…(but you need) data ethics, strong information governance, good policy, or the rest of it, which enables you to take those questions you know to take those steps, even if we maybe don’t really answer, you can take some controlled experiments.’
‘But for me I mean, I think it will come to you know, by processing things like ethnicity, are you contributing to improving health outcomes? Hopefully the answer is yes. Are there any other biases you’re baking into the system? How can you address those? Best practice I guess, is evolving in that space.’
Product owner
As one of the teams interviewed suggested, having data ethicists and philosophers in these discussions might have value. This supports a call for a humanities-based agenda in health,42 which will help interrogate ways in which inequalities are observed and mitigated in data-driven systems.
Implications
- This research shows examples where inequalities are poorly understood by people commissioning or designing data-driven systems, and where it’s not clear whose responsibility this is. This may lead to the development and adoption of data-driven systems that, for example, overlook people without access to digital technologies, miss ways in which data collection practices are not accurate, and/or categorise people in ways that obscure nuance. All of which can perpetuate health inequalities.
- Systems must be set up and designed with inequalities in mind, from understanding what is meant by inequalities, to carefully mapping out available data to consider whether it’s sufficient, and embedding success measures that aim to reduce inequalities or detect exclusions. Commissioners and designers should be thinking about this from the outset – use cases that address inequalities can be a starting point for building systems, and working closely with marginalised communities throughout the development process may also ensure key decisions are holistically thought through.
- Clarity around whose responsibility this is, creating multidisciplinary teams and agreeing on where it sits in the commissioning/design process, will help identify gaps.
Tension between local and national priorities for design and delivery of data-driven systems
Differing approaches to design and delivery of data-driven systems at the national and local level are linked to political priorities and power dynamics, which can compromise the quality of insights.
There was evidence that more thought went into addressing health and social inequalities at the local (rather than national) level. As a result, there were sometimes tensions about the best way to achieve equity in the deployment of data-driven interventions.
‘First of all is that think things that we tend to get from a national level […] The assumption is always that we want aggregated data and we don’t. Yeah, this is our local population. The more granular, the better. It is better to have disaggregated data that we then aggregate than it is having aggregated data in the first place. Because I think that doesn’t allow us to kind of slice things in the way that we want to.
‘A really good example of that is that the vast majority of stuff that we get and have got starts out [as an] LSO43 area […] then someone will come along to us and say can you tell us about vaccines by ethnic group or by gender, or you know whatever? No, I can’t because I’ve got it at LSO level.
‘All I can tell you is that there is something coincident between high levels of vaccine uptake in that LSO with its ethnic makeup […] So immediately by taking that choice to aggregate things and to do it in the way that we always do it that immediately inhibits our ability to analyse that data very well at all.’
Analyst in a local authority
Top-down decisions about who could do what with the data platforms may therefore impact and influence inequalities. Not addressing these interactions can also lead to siloing of work, which leads to duplication of systems, and potentially results data-driven systems that are not fit for purpose.
‘But from a local perspective, from an analyst perspective, we just want to be part of a wider landscape that deals with data as a system asset and an asset that we can be collectively using. You know I don’t need, as a local analyst, I don’t need somebody to develop at all for me to be able to visualise some data. I need the data.
‘I think a ground-up approach to a lot of this stuff would have been a lot more successful than a top-down one because you know, we do naturally, you know as places you know, it’s local authority, networks, health networks and so on. We do naturally do things and share them. You know that that’s what we do.’
Analyst in a local authority
This ground-up approach was not always agreed by those working at national levels, as those in positions to decide how health data could be used preferred data to be standardised first, so that national priorities on how to use data could be set:
‘Again, there are many dashboards, so there are many data sources […] but on the whole they should be using the same national datasets that often flow via NHS Digital. Yeah, OK, so the same issues that you would have had with data quality are the same issues that they might have as well ’cause the pipelines are long and also go across generations.’
Product owner
These power dynamics and ways of working often bypassed or obscured local intelligence and conversations which can flag demographic information that is important for mitigating inequalities.
Some stakeholders suggested it was possible to find a workaround to get more useful data from local sources – but that it would still be subject to political drivers, and still needed a nuanced understanding of inequalities or priorities:
‘You can select, you can setup functionality within [software] that allows those regions to directly submit their own original data to begin correcting that inequality instead of going through the whole like, ok, this came from here, this came from here. So we need to rectify this source system, but that’s difficult for the local political reasons that made it an incomplete data source in the first place, so you can integrate these data from different sources to begin to rectify specific missing pieces of data.
‘You can bring in a much more diverse set of stakeholders to begin to interrogate, like how a model is actually situated within a specific sociotechnical component. Locally interrogate the model to see how it’s performing against a certain mathematical function. You want to ask a much broader range of questions about is the data that the model was trained on suitable for the ultimate societal changes that that model is inflicting?’
Privately commissioned data team
Ultimately, deciding what was commissioned became a political issue, and there is no evidence that anybody took responsibility for adapting the commissions to what emerged as the neediest areas. Some stakeholders stated that they were only there to bring the data together, or felt disempowered to bring in local priorities:
‘I suppose there’s a “cause there’s a government definition”. That’s what you do. You put the data out and someone else decides what the policy is.’
Dashboard team leader
‘We did have people coming from London on a regular basis to kind of give us advice and say, tell us what we should be doing, because actually I think public health, when it’s within, at a local level, they know where the problems are, and we were really trying to make sure that we were communicating really effectively with our communities.’
Local public health director
Tensions between local and national decisions on how data was centralised and its uses meant that the priority areas in the pandemic, for some, became subject to knee-jerk reactions rather than managed as well-thought out focus areas.
Such ways of working led to a lack of cohesive communication and feedback between local and national bodies, impacting the system’s overall ability to address inequalities in health.
This was notable in one participant’s suggestion that decisions were not always shared widely and at times they found out about specific areas of national interest only when they had been mentioned in the news, rather than being directly informed:
‘So this is how, early in the pandemic, that this happened. They got called into an office and somebody asked me to produce them a map of everybody who’s over 60 years, of where people who are over 60 years old were in our borough, and I said, why do you want this? And they said because it’s been on the news that people who are over 60 are more susceptible to COVID. I spent the next hour telling them why that wasn’t a very, you know, very effective way of targeting any kind of support.’
Local public health analyst
Implications
- Tensions between local and national priorities (and national most often taking precedence) can adversely impact data-driven systems’ ability to address health inequalities, as local nuance and knowledge can fall between the gaps. The use of data standards to process and clean data to fit the needs of a national public health body can cause the loss of contextual information that is useful for local public health officials.
- Commissioners and policymakers need to think about how to create partnerships that allow flexibility to address local needs while also feeding into national goals and enabling comparative data. Coordination and communication between the different levels, and improved resource allocation will be important going forward.
Data quality and diverging inferences
Having high-quality data that accurately reflects the reality of the people it represents is essential for producing meaningful insights. As the phrase used frequently in data processing ‘garbage in, garbage out’ suggests, having poor quality or incomplete data can cause unequal outcomes in downstream uses.
UK Statistics Authority reporting shows that there is a data gap around what information is available, which impacts who can benefit from health interventions.44 When there are groups not represented adequately in data45 or in genomics studies46 – including ethnic minorities, migrant communities, and asylum seekers – any analyses will result in further inequalities, as shown by a report by the Nuffield Trust in their review of NHS data.47
One major data quality issue we identified was missing data. For example, when ethnicity data is missing for patients, coverage of certain demographics becomes patchy.48
When emerging insights are based on this incomplete data, it can lead to worse outcomes for those demographics. While local data tended to be better for responding to the pandemic, the usefulness of data-driven insights is still limited by these gaps. Data quality depends on who enters the data, what they choose to record, and even whether or not people have ever interacted with the health and social care system, or the local council.
People missing from datasets might include migrants who may not have GPs, or people with mental health issues, who may never have contacted their local councils for support. If someone does not exist in a database, there was no way a data-driven system can make them visible. Indeed, one of OpenSAFELY’s reports noted that:
‘Our population, though extremely large, may not be fully representative of the full eligible population: it does not include individuals not registered with a general practice; or the 4% of patients registered at practices not using TPP and EMIS.49 Primary care records, whilst detailed and longitudinal, can be incomplete on certain patient characteristics. Occupation is generally not available in the health record, so we were unable to assess the eligibility in priority groups 1 or 2 where this is based on occupation. This means that we could not determine the appropriateness of vaccination for those in the ‘other’ group. For patients aged 80 and over, 36.2% and 0.8% had missing ethnicity or IMD50 information respectively.’51
Time-delayed or out-of-date data was also a problem, particularly in the context of a quickly evolving pandemic situation. With little on-the ground capacity, data was sometimes submitted late, or – due to pandemic pressures – wasn’t always processed or deliveredor time across all data collectors.52 For example, the COVID-19 situation report was often affected by data quality issues driven by some NHS Trusts not submitting data in time to be included in data releases.
In another instance, vaccination data in one centre was described by a product owner as coming in once a week on a Friday, meaning the insights needed to procure new vaccinations might have assumed little activity in those areas, which would have impacted on vaccine deployment, so that potentially it was unmatched to actual vaccine need.53 54
These gaps or delays in data can lead to divergent interpretations of that data, and create systems that do not comprehensively respond to inequalities on the ground. This was the case especially when looking at data gaps that were driven by resource issues on the analysis side, rather than by lack of or ability to respond to local needs.
As the data pipeline involves many transformations, deploying a diverse and multi-disciplinary team to data collection activities gives higher chances of picking up gaps in data and ensuring the pipeline does not lose vital contextual information.
Two participants from different organisations even suggested that as one builds their team, they should ensure the team members are representative of the community. This approach strives for more inclusivity in data insights, should recognise gaps and inconsistencies quicker, and generate more equitable outcomes.
Implications
- Gaps in data and time-lagged data (especially in a health emergency) can make it difficult to respond to inequalities on the ground. Any interventions made based on poor quality data are at risk of being inaccurately targeted, misaligned with the situation on the ground, and disadvantaging people who aren’t represented in the data.
- For product leads, researchers and data analysts, having diverse and multidisciplinary teams can help pick up gaps in data which would lead to inaccurate insights. Finding ways to involve community representation in gathering data, and being clear about the ways in which it will be used (so analysis and insights are specific to the situations being addressed), could help create more inclusive and accurate datasets.
Data curation and lack of ability to address inequalities
Data curation risks losing nuance in the data that may be important for flagging and tackling inequalities, especially if it’s done in a top-down way. Aggregated data and visualisations can obscure important information about raw datasets and their limitations or original purpose.
During the COVID-19 pandemic, decisions had to be made about how to use health data beyond the purposes of directly supporting patient care – for which it was initially gathered.
While data-driven systems had mainly been set up to address regular, ongoing healthcare, in a public health emergency it was crucial that these systems could respond at pace. Data was curated and cleaned in a way that new and multiple players could make use of it quickly, but this also meant that nuances in the data were flattened in favour of simplified aggregations or visualisations.
Alongside this were issues of poor coding and categorisation, and the fact that data curation was largely done in a top-down way, which could obscure important information about raw datasets and their limitations or original purpose.
In a time when new private companies were playing a prominent role in data curation and onward uses, scrutiny fell on the role of institutions such as Palantir and the widespread use of their software, Foundry. Their influence led to new demands for standardisation and cleaning of data in ways that not everyone in the pipeline found useful.
When it came to processing or decentralising data, local partners preferred to have and manage their own raw data instead of having data insights imposed on them by various other platforms through centralised curation and storage. This data curation was expressed by one of the as further compromising the standard of the data that already came from badly designed systems prior to the pandemic:
‘The quality of data that’s being supplied to us by all of the organisations that collected data in the COVID response has been appalling, not just data quality for the same reasons that we all know that we have with data quality in terms of completeness and coverage and things that people you know won’t give us. Can’t give us, whatever. We all accept that. That’s what happens in life, and we’ve all worked in data. What I can’t accept is data quality problems that just come from poor system design. And that’s what we’ve had. We’ve had more issues that are down to poor system design, then down to the classical things.’
Business intelligence lead
During the pandemic, health data was often repurposed and used in ways that differed from the original intent behind its collection. While data had previously being aggregated for cancer, ethnicity monitoring and other public health surveillance, the pressure to combine different types of data from different sources for pandemic responses provided a new challenge.
When data needed to be analysed for pandemic-related purposes it was revealed that, at scale,. For example, the Office for National Statistics (ONS) audited ethnicity data sources and found that ‘this initial stocktake of the ethnicity data has highlighted potential issues with the comparability and coherence of the data sources.’55
One participant mentioned having to choose between building platforms that gave them flexibility to input important information about inequalities, or selecting a ready-made product that limited the insights that could be generated for different populations.
Sometimes data technologies fuelled a digital-first approach to data collection, with the data then being funnelled to address specific needs like vaccine management, surgery prioritisation and follow-up care. For example, when Dr Doctor rolled out its elective recovery management support, it produced information to enable patients to participate, including how patients could provide additional information to support decision-making.56 This involved patients scoring their pain or wellbeing against set criteria.57 58
A question one could ask about data curation is whether it’s better to use ‘routinely collected’ health data (that is: the data generated, collected and stored by the NHS as part of the delivery of services) for pandemic responses, or specifically collecting data to respond to an ongoing need.
Collecting data in response to a specific need may sometimes have advantages for nearer real-time, specific, patient-supported use of data, but its success in mitigating potential inequalities requires platform developers to ensure their tools are accessible (e.g. on language and accessibility), and be aware of biases in data that occur when patient-reported measures are used,59 to decide who gets what care and when.
If a system relies too much on patient-reported measures, it can lead to unintended outcomes and inequalities – all related to missing information because of the way data has been curated, and selective participation because of access/use differences with digital technologies.60
Questions around the role of large institutions (including private companies) in data curation and analysis were also raised. When tools such as Dr Doctor and the Foundry platform by Palantir are focused on fast data availability and seamless data flows, the lived experience of potential patients gets flattened out. The way that data is curated does not always address those social factors, which are important in determining health and wellbeing – for example data about people’s housing, employment and digital exclusion as social determinants of health.61 62
Decisions around data curation and platform development also affected what it was possible to do with the data, sometimes limiting flexibility to discover or accurately represent inequalities. In one case, a participant suggested that there were trade-offs that had to happen in choosing which tools to use:
‘On one hand we avoided analysis paralysis, but I think I would have probably made some slightly different technology choices… I don’t want to use [proprietary name] products for all of our open data dashboards. So I think there’s some value in doing some [analysis] built using [another product]. It’s much more scalable at volume… but [proprietary name product] is like a white label product.
‘So instead of building it yourself you take it off the shelf, plug in some data, make something really nice and push it out. But I’m buying the product. What I’m not doing is handwriting code to run my visualisations straight up on the data. So I think like technology decisions for data there is, I always think the first fork in the road you have to say is like where am I going to use [proprietary name products] but if you’re using them, you know you’re probably going to have slightly less functionality, slightly less flexibility, but you move a lot faster because you just take it off the shelf right now, and it’s more supportable, because when writing your own code, how do you support it? You know? How do you know, there’s a whole load of other complexities that come with that right? And it’s in that decision and that balance. Somebody give me six months, I might have gone a different [route].’
Product owner
Some participants appeared frustrated at the use of standardisation across the NHS’s data systems and the many pipelines where data was transformed, which made it difficult to see how the data had changed over time.
‘So immediately by taking that choice to aggregate things […] immediately inhibits our ability to analyse that data very well at all.’
Asked what change they could have made given lessons from using data-driven systems in a pandemic, one team responded:
‘Don’t panic, because I think a lot of the services that, you know, the faults with the services that we’ve described, have come from people panicking and thinking we have to put something out there really quickly and, yes, sometimes we have to do things quickly. But what we should do is scale down our aspiration of what we’re going to do in order to do that.
‘You know if we have to do stuff quickly, just publish raw data and then work out what we need to do next, that’s the second thing I would certainly want to reflect in a set of recommendations from anybody, particularly when I don’t know what the target of this is.
‘Have an agency within government that is responsible for data infrastructure and not just in this kind of situation. Because we don’t do that at the moment. You know, if the DHSC has an initiative to launch, they hire some people who build data infrastructure… we haven’t done that with digital services, they designed all of the services that I have picked particular flaws with so maybe they’re not ready to do it either, but you know, it’s not like we’re short of people, it’s one of the biggest assets of this country. To be honest with you in terms of competitive advantage over other countries, we’re not exploiting that.’
Local public health team
Implications
- It is important to consider questions not only of who holds responsibility for data curation (e.g. national bodies like NHS England, or private companies like Palantir), but also how cleaning and curating data for quick and/or widespread use can impact on the quality of insights and outcomes.
- System engineers and product designers can think about what might be lost in standardisation and visualisation of data, and ways to embed flexibility in platforms, for example allowing users to see raw data or include context-specific information.
- Again, coordination between different players in the data ecosystem will be important going forward: discussion between data analysts and commissioners or designers could help raise issues of limited functionality for flagging or addressing health inequalities.
Data as a proxy for truths and reality
There is always a limit to how accurately data can represent lived experience. Using proxy data can help to infer or estimate something not covered in a dataset, but this isn’t a silver bullet, and it’s still important to look for where data diverges from reality.
One concern we noted in the discussions around the potential of a data-driven system to achieve its aims, was that at times, data was taken to present a complete version of truth or reality, or that it represented a particular view of the world at a point in time. In fact, there are always limitations to what data can tell us, and trusting too much in data as a proxy for reality could lead to poor quality insights. Some participants expressed this difference in what was collected versus what it actually could tell us:
‘Dashboards can be seductive, give you nice clean view of the world and you forget it’s just a representation of the world that may be skewed. Part of our job is to tell you why it’s skewed, and that’s a constant challenge.’
Product owner
Some responded to this by combining new datasets to enable faster health-related interventions, in some cases potentially mitigating inequalities that may have emerged when only working with singular datasets. What was clear, however, was that such benefits accrued only when teams worked together and took on feedback from those working with the data that enabled the inclusion of better contextual information:
‘One of the great parts about OpenSAFELY is how responsive they are to our needs and how willing they are to listen and take direction and involve us very directly. Apart from the physical coding of the platform, we can input [for example] if you wanted to look at the role of household size, does it have an impact on ethnic inequality? And outcomes, you know they put together an algorithm, which counted up how many people lived in a household and then gave me a variable which was for each person, this is how many other people they live with, then we had all these really big houses of hundreds of people. And I was like what are these houses? And then they were able to get Ordnance Survey stuff, right? So they were able to say these houses are prisons or social care homes, right? And that was useful: I’ve never seen that in healthcare data.’
Researcher
In this way, having more granularity and context on data was helpful but importantly, the ability for data users to interrogate and be in discussion with data curators, data generators and platform owners was even more valuable as it helped to unpick some of the knots in the data pipeline. This interdisciplinary approach enabled more accurate and specific insights, (and in turn, more appropriate interventions in a particular area) than would have been achieved by using one general dataset.
In another example, a public health consultant showed how they had used local council data organised by postcode, and overlaid it with information about changing demands for foodbanks – meaning that insights could not only be time-specific or fixed – and demonstrating that data-driven systems need to have in-built mechanisms to show changes over time.
One team discussed how they turned to prescription data to give them an idea of what conditions people in the datasets they were analysing might have been experiencing (since GP recording of health conditions was not always updated). These participants were clear that, while this might have been a workaround for missing data, it still left questions around accuracy, as a lot of the medication could be prescribed across different health conditions. This limited the insights that could be gleaned about vulnerability to COVID-19, and meant that subsequent recommendations about appropriate measures to take for those included or excluded from the data had to be carefully caveated.
As was seen in the previous knot about data curation, however, combining different datasets and adding new information can be problematic, and doesn’t always fulfil the intended purpose of better representing reality. There were examples when data presentations and anticipated interventions using combined datasets did not match expectations on the ground. As one participant put it, over time, these concerns could be addressed, but at the start of the pandemic, they presented barriers to quickly using and understanding the data:
‘The [data dashboard team] then started building aggregates and visuals. It was actually a hindrance because a lot of our staff start looking at these aggregations and these visuals, and they said that’s telling me a slightly different story from what you prepared for me. So what was the cause of this difference? And then we spend a lot of time trying to work it out, and the answer would be that [the data dashboard] had got a different time signature on something […] So that’s a real hindrance.
‘But I find that what they’ve produced over time has massively improved and there are things now, and particularly some of the stuff around chains of transmission in particular, they’ve done so well with that. And they’ve communicated it really well as they’ve gone along. So much so that we’ve got confidence in that and we know the provenance. And we can explain to people right now you should go and use that.’
Analyst in local authority
The reality of what data could and couldn’t do, and what successful data-driven systems could achieve, became especially salient when algorithms were used to help decide and prioritise interventions. This point that data was a proxy, influenced by who was and wasn’t in the datasets, was really articulated by the participants from a local public health team who said:
‘We picked up around 350 families in [a local authority] who ended up taking up support from us, who hadn’t been identified in any of the ways […] so that sounds like a measure of success right off this scoring. As much as this is a better tool than these national algorithms for vulnerability or for understanding who’s at risk, depending on what question you’re asking you also get some people falling through and some people not, so you could be vulnerable in one context but not in another context.
‘The biggest [potential area for improvement] for us is we only have data on people who come to us, so a really good example of that was we wanted to include nationality as an indicator for the mobility index so you know non-English nationals or people with English not as their first language would score something on vulnerability. And we don’t have a universal data set. We don’t have anything that we collect.
‘So [on] these sort of key protected characteristics [like ethnicity] we have some inherent bias in what we hold, because we only hold data on people who access our services, and there are some groups that are more likely to access services and therefore we can over-score on the vulnerability of people.’
Local public health team
One way to make sure data could provide a fuller picture was through the use of emergency legislation that allowed for linking of different datasets. Control of Patient Information (COPI) notices, first issued on 17 March 2020, provided ‘NHS Digital with the necessary statutory power to disseminate confidential patient information to organisations permitted to process confidential patient information under Regulation 3(3) of COPI for the purposes set out in Regulation 3(1) of COPI to support the Secretary of State’s response to COVID-19 (COVID-19 Purpose)’.
COPI would allow ‘NHS Digital to disseminate confidential patient information in respect of which it is a controller, including that which it has obtained by complying with a direction made under section 254 or a request made under section 255 of the Health and Social Care Act 2012 (2012 Act), to a person or organisation permitted to process confidential information under Regulation 3(3) of COPI’.63
At the time of interview (August 2021), one analyst worried about life after COPI, stating that the interventions that emerged by accessing new data on people could be lost if these provisions were not kept in place. In their view, all the vulnerable populations they had ‘discovered’ were only made possible by large data analyses, enabled by new abilities that suddenly allowed Clinical Commissioning Groups64 (to become Integrated Care Systems)65 to see patient identifiable information, where prior linking outside core NHS business systems was difficult.
Consequently, there was a concern about how data-driven systems would be less able to tackle inequalities if these data channels were to close beyond the pandemic. In the Data Saves Lives5 strategy and the plan for digital health and social care65 that was set out in June 2022, commitments to continue to allow data sharing were suggested, but it is not clear yet just how this will look.
The analyst, however, highlighted that despite COPI, unlinked data still remained, such as that in care homes or held at community level, which was not held in hospitals (because health care was not just hospital-based).
Implications
- People using and analysing data, or people recommending interventions based on data, should not assume that data can tell the full story, and instead actively look for ways that lived experience might differ. This is again a matter of identifying gaps that could lead to unequal outcomes.
- Using proxy data to bolster existing datasets can help provide important context, but it’s still important to interrogate the ways in which data diverges from reality.
- Policymakers could think about ways in which different data sources could continue to be linked, and different channels of data sharing staying open for certain purposes, as with COPI during the pandemic.
- This knot is especially important for those designing or commissioning algorithms to prioritise interventions, like the Shielded Patient List.
Lack of historical or situational knowledge
Analysing data without contextual knowledge can lead to misunderstandings and poor-quality insights, often stemming from issues of coding and categorisation. Multidisciplinary approaches to data analysis – bringing in supplementary information about place and demographics for example – could help mitigate this.
Some participants highlighted that when categories or variables were created about people, it was not always clear what those categories meant. For instance, while ethnicity was an often-raised issue, there were concerns that it was becoming a catch-all concept rather than something to be interrogated. There were worries that people with little understanding of data analytics did not appreciate the complexities of ethnicity-based research and the role of deep epidemiological research, or that sometimes analysts themselves might be aware of the issues based on personal experience, but could not change the system to collect better data.
This was overlaid on already known issues of coding and categorisation, which meant that data represented different things to different people. An example was highlighted by a researcher using OpenSAFELY systems to interrogate pandemic impacts on minority groups, who called out that those using data may not always have had the appropriate grounding to understand the meanings behind certain concepts.
‘I think one of the main concerns we had when we first had our work is like, oh look, they adjusted for this and therefore it [a variable] can’t be that [concept], it’s like that doesn’t mean the same thing. Just because you’ve adjusted your account for a variable in your data doesn’t mean that variable captures all of the complexity of what that concept is.’
Researcher
Unless you knew of these gaps in interpretations and their links to the ways data was collected, it was likely that there would be a misunderstanding in emerging data insights. At times, researchers detailed how they resolved this by working alongside the technology designers to query any gaps they saw:
‘Are there more useful ways that we can use these data? So that’s one thing that we’re looking at, but I think, particularly around the drivers of inequality. So obviously ethnicity is one. But then there’s this whole network of things, you know there’s a lot of really important information that we just cannot get out of health records without linkage to other things like the census or even cohort studies.
‘So we don’t have information on people’s home life experiences, we kind of estimate how many people they live with. We don’t know much about their communities or how connected these households are, right? It’s not just like exposure from a family, but like how often do you visit other people and take public transport.’
Researcher
Local teams who knew their populations were able to look beyond the Shielded Patient List or Q-Covid results and go further by overlaying community-based public health and inequalities knowledge to create a tighter safety net for people. This meant information about unemployment, smoking, deprivation and social connections could help ensure that health-based, data-driven systems could be used to benefit communities. Third-sector partnerships and volunteer organisations, as well as combined local health and authority boards, were crucial for creating more meaningful data-driven systems.
‘One of the things that we did in March 2020 was we built a vulnerability index using internal data that that we had access to in order to try and get the council to prioritise proactive support for people who we deemed to be vulnerable. We went a little bit further, like a lot of local authorities but we went a bit further with it, and crucially we had a lot of crossover and a lot of contact with our health organisations, so it was very much a partnership approach that helps us develop […] [for example, it] gives me information around COVID, age, sex, to supply information on the COVID situation locally and with this overview. Shifting away from COVID would be the short-term plan and then shifting away from that towards a more population health position.’
Business intelligence lead
When it came to implementing or accepting national mitigation measures, a lack of historical and situational knowledge was an issue. Indeed, one participant highlighted that while AI and machine learning would be useful additions to big dashboard and data analytics, without an in-depth understanding of inequalities, there would only be biases and inequalities emerging and existing inequalities would be exacerbated.
On the ground, this lack of local contextual knowledge was apparent in the deployment of stay-at-home measures based on the R-number (itself a calculation based on infection rates and contact tracing efforts). Aside from the fact that not everyone may have been able to upload their infection status, R-numbers68 also relied on compliance, which was based on the assumption that people would be impacted the same way, either by infection or by spread mitigation measures.
For instance, in areas where there was relatively good health but a transient or low-paid population, R numbers might not have had as large an impact on the overall health of the population as in those areas with relatively worse health and the same employment status. One case in point was noted in a local authority, where our participant noted higher rates of insecure work, lower average wages and therefore lower access to sick pay.
This meant that the interpretation of the R-number was itself often driving inequalities further as communities were having to decide between putting themselves at risk of infection (by going out to work) or staying at home and looking for alternative forms of support via Citizens Advice Bureaus and Mutual Aids, and government support where available. A public health team said that in this way, pandemic-related data-driven insights were out of touch with reality.
One researcher noted that even when people were offered vaccinations at the start of the roll-out, some individuals were offered places that were far away, meaning they declined or did not turn up for their vaccination – something that, without context in data analytics, could look like low rates of uptake with no explanation. The controversies around the use of the R-number69 70 show how gaps in data collection and a lack of cohesive and joined-up discussions between local and national bodies (as noted in previous knots) combined with this lack of context can replicate and exacerbate regional inequalities.
Inequalities were not only stratified by ethnicity, but by other factors including living and working conditions, as shown by the interconnected spheres of social determinants of health. Arguably now there’s another dimension where data-driven systems interact with each of those layers, which drives home the importance of historical and social context in data analysis in understanding to what extent that data has been mapped to overall life experiences.
Figure 2: The social determinants of health71
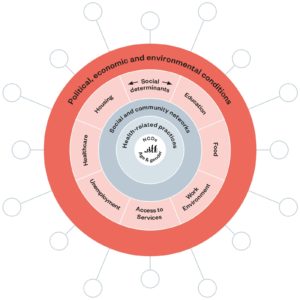
Implications
- Similarly to proxy data issues, data devoid of contextual knowledge can also obscure lived experience and lead to inaccurate interventions.
- People using and analysing data or recommending interventions should solicit expertise from diverse stakeholders, especially those who have historical or local knowledge about the demographic and/or area that the data concerns, and existing inequalities related to social determinants of health. The ability to coordinate across channels in this way needs to be strengthened and embedded into the data pipeline.
Overall implications of a knotted pipeline
While we have the knots as a conceptual framework, we have tried to show that they are rooted in the processes and cultures of organisations. What can be lost in the discussion sometimes is the impact on society as a result of the knotted pipeline. In the next section, we describe the societal consequences of these knots and will demonstrate how the knots came together in observable ways.
This final chapter is a description of how the interventions of data-driven systems impact on health inequalities in reality, using pandemic responses as an example, and shows why addressing the knots can improve outcomes for people across:
- health and social care
- pandemic preparedness
- future use of data-driven systems in the context of increasing inequalities or unequal outcomes.
Creation of system unequal impacts
As the pandemic unfolded, data used to build dashboards was changing constantly and had numerous errors,72 combining sources in which completeness for potential inequality measures was not always defined, and excluding some primary care sources that were not aligned with data input73 – as noted with some work conducted via OpenSAFELY on the spread of vaccine uptake.51
An attempt to generate analytical insights and interventions saw the rise and use of algorithms and risk assessments across populations,75 and outputs changed as new information was put in, or old information updated (e.g. from the Shielded Patient List to Q-Covid to the high-risk patient list).
The outcome of this continual data analysis led to an extra 1.7 million clinically vulnerable people being advised to stay at home a year into the pandemic, with implications for many about economic welfare support that were not always considered or provided for as the pandemic wore on.76
Outcomes of prioritisation tools rely on the data available, so a lack of complete data or population coverage could well exacerbate inequalities in health by excluding certain demographic groups from full participation.
Health Foundation research found that ‘there are limitations to the use of an algorithm-driven approach for identifying the clinically extremely vulnerable population which were exacerbated by poor availability of high-quality data.’77
It found that ‘not all clinically extremely vulnerable individuals were identified through the centrally developed algorithm due to lack of linked data or incomplete medical records, and many people would have been missed had they not been added to the shielded patient list by local clinicians.’
These algorithmic approaches resulted in significant variation across local areas in terms of who was identified as vulnerable and when and affected what services and support they had access to.
Research activity increased during the pandemic and drew in new sources like genomic data to try and focus interventions to specific populations. Genomic data, itself a very limited database in terms of diversity,78 started influencing data-driven insights. Some of the resulting data about whether impacts from COVID-19 were biological (and whether genetics alone could explain what was happening)79 80 was confusing and controversial, and revealed a lack of historical or contextual knowledge.
While broad data insights had suggested ethnicity links to health outcomes, what was clear was that, genetics-related or not, the pandemic’s impacts had deep rooted links to historical and institutionally ingrained cultural practices, which persistently left the same groups marginalised and facing increasing negative outcomes.81 This concern was raised by a participant working in genomics, who highlighted that extra resources needed to go into extending recruitment from minority groups to ensure research and clinical care was not disproportionately impacting or leaving out certain groups, and that patients were appropriately prioritised and triaged:
‘And we talked about risk scoring and the dangers of risk scoring, one of which was how do you make it meaningful to people if you’re basing it on potentially these broad categories that don’t actually match with how people see themselves? And if they are working and get scored as vulnerable, then you can’t go to work and I guess it’s for me is one of the worries around potential algorithms or risk that might come out of genomics that actually we then find out is not accurate.’
Another way in which inequalities may be amplified is when data-driven systems are geared toward a digital-first approach, for example, health information or care delivered through smartphone apps.
This limits the groups of people who would immediately benefit from the insights or interventions those tools provided, and consequently whose data could be used to design further tools. Those who usually did not benefit were the elderly, those not digitally connected, and some with chronic conditions.82
As noted by interview participants there were many people who were invisible in data-driven systems during the pandemic, including those with no NHS numbers, those without a smartphone, those with language barriers, those with hearing and sight impairments and migrant communities.
A future of health that is premised on digital technologies, invariably relies on, or leads to, collection and analysis of large quantities of data. Limiting those who can interact with those technologies means that only particular demographic groups are likely to have their needs represented in the ensuing analyses.
Addressing systemic inequalities and the potential outlook for the future
While some specific ideas about how to make patients safer were emerging or being reviewed in response to the pandemic (e.g. the NHS Patient Safety Strategy),83 it remained unclear how policy could explicitly direct the implementation of data-driven systems to address inequalities in health.
One gap that needed addressing was how equity, diversity and inclusion, as described in the above Strategy, related to health inequalities in practice.
Throughout the pandemic, there was evidence that organisations were responding to potential gaps in the data. For instance, Public Health England created analytic tools84 under the Office for Health Improvement and Disparities, such as their COVID-19 Health Inequalities Monitoring for England (CHIME) Tool,85 which provided an initial understanding of the spread of inequalities, especially when mapped on to the interventions deployed during the pandemic.
The related Health Inequalities Dashboard86 and Wider Impacts of COVID-19 on Health (WICH) monitoring tool87 included select hospital activity data, behavioural data, air quality and grocery shopping – variously broken down by age, ethnicity and sex. This attempted to bring in multiple factors to explore the impacts of the pandemic, but would still rely on local contexts to truly understand any differential impacts beyond region or country. It remains a good start to understand changing trends across multiple demographic factors.
Beyond these large national systems, new and increasing measures are being introduced in local NHS Trusts to manage risk and bed allocation using algorithms. In our research, algorithm-powered prioritisation systems are increasing in prevalence, and their immediate impact on how patients are treated is of interest for many reasons, including economic and administrative ones.88
These systems are increasingly being deployed across the NHS, with localised trials beginning to take place, some of them broadening data use to include social determinants of health.89 Some of the platforms and tools we examined in our desk-based research (for example, Dr. Doctor and Palantir’s Foundry) were those to respond to the increased hospital waiting times through patient triage or bed management.
As with the national bodies, it appeared that the lack of specific inequalities-driven designs or universal metrics of success meant that developers, at least during the research phase of this project, used measures such as accessibility and behavioural insights to help them define inequalities and impacts.
The teams used information about what might influence someone’s ability to attend a hospital appointment, such as rural locations or zero-hours contracts, to consider ways of improving that patient’s journey. At the time of research, the tool was yet to be publicly evaluated, so its success or impact is not known. It is also possible that the tool has progressed since this report’s evaluation and now intentionally designs for wider inequality measures. It is difficult to find this information on a public forum and our insight is based on research discussions across various teams.
Currently, platforms like these can only let us glean broad insights about the coverage of different demographics based on the NHS Trusts that have adopted it as part of their care management.57 It is not easy to say who is likely to benefit from the introduction of such tools in those hospitals, given the historical inequalities some patients in those areas might already face, which may not be captured or weighted heavily in the data.
The critique of risk-scoring systems mentioned in the previous section – that they do not adequately harness the knowledge of local communities and can therefore exacerbate inequalities – may be contrasted in the proposed work by a local public health team we interviewed. The intention of this team was to trial a vulnerability score to triage patients on their local hospital waiting lists, using multiple sources of contextual data, and seeing how well it applied to people’s lived experience. This demonstrated one of the biggest differences in how data-driven systems could be used by local teams versus those with a broader geographical focus.
The local public health team used deprivation levels available through social and economic data, to understand how someone became vulnerable in the pandemic, combining about 30 databases including utility, social housing, benefits claimants and safeguarding databases, to create a combined inequality score with which they stratified their population. Members of this team suggested very strongly that to ensure inequalities were not ignored, one needed to start at individual levels rather than national or population levels, in order to get the appropriate insights that would otherwise get lost in aggregate population data.
Conclusion
In the UK, the multifaceted health and care sector and its related pipelines of data encompass multiple individual activities. In combination these activities exert different outputs on people and because of this, there are numerous areas where small changes (untying the knots) can have significant impacts.
Across the multiple stakeholders operating in the health and social care system, there is a need to ensure more joined-up decisions on responsibilities, measures of success and people-centred approaches to data-driven systems. Responding to such concerns will build in a supportive framework for ensuring potential health inequalities are flagged and addressed in the deployment and prioritisation of new technologies.
When considering what needs changing and how, it is important to know how these knots could be prioritised, based on how we understand them to impact the flows of data and insights. Each person coming into the system, as noted in ‘How to read this report’, can change their approaches to workflows and data management or decision-making.
We do not expect any one person or organisation to solve the knots, but encourage that:
- commissioners factor inequalities into their decisions, require that data to monitor inequalities is part of the technology they commission, and recognise that data-driven systems that are good for the wider population should still work for the local communities and individuals
- analysts bring an understanding of social context into their analytical decisions and interpretations
- data curators recognise the need to balance standardisation against loss of nuance and context
- product designers or engineers enable systems that incorporate local flexibility in data collection, and demonstrate how they have considered inequalities in design and testing
- overall, there is a need to bring multi-disciplinary teams together, in conversation, so that nobody works in silo, and to involve underrepresented people in these conversations.
These small steps and changes in ways of working will create ripple effects and enable the system change required – where approaches to using data-driven systems embed definitions and metrics that can help address inequalities from their inception. Addressing the very first knot of clarity of definitions and impacts could trickle down to addressing overall systemic health inequalities.
There are likely to be many approaches to addressing these knots on a broader level. Two approaches that have the potential to have real impact on inequalities are:
- those that design local interventions and tools for people’s experiences of health and wellbeing inequalities
- those that take on wider systems-thinking decisions and information flows within the NHS.
The first would create a critical mass of knowledge about what the inequalities we’re interested in addressing are, what metrics to measure successes by and how data can relate to inequalities (e.g. intersectionality).
The second requires policy recommendations that drive and enable infrastructural and institutional cultural adjustments. This will result in practitioners realising their roles within the data pipeline and shaping the ways decision-making influences outcomes. This will eventually translate into benefits to society.
Currently, many data-driven systems are created and propped up by assumptions about which data or experiences are deemed important in decision making, and which are ironed out as ‘noise’ or seen as having little value to the overall measures of success.
A new approach would need to take various dimensions of identity, place and lived experience as the lens through which we can fully explore the benefits and disadvantages arising from the presence of data-driven systems. This would move away from seeing data as simply categorisations of people, for instance, and instead embed the data within dynamic and complex contextual frameworks that encompass the experiences of people and the roles of institutions and those who work in them.
As we look forward to a continued acceleration of data-driven systems in health, now is the time to really focus on where inequalities lie, and build data-driven systems that are better equipped to address them.
Next steps
Recommendations emerging from our work will need to respond on a practical level to the problems we have identified in the data pipeline. To discover and describe what such approaches to systems and cultural changes might look like and how to implement them as recommendations, we are exploring ways to dig deeper into the policy landscape, and work with stakeholders from across data-driven systems to understand how their different roles align with our description of the knots. We hope this will generate further insights that allow us to tailor recommendations for each knot, but also for the entire pipeline.
To ensure health and social equity is central to any new and ongoing data-driven interventions there are two key areas that will need to be addressed for future policy:
- An approach to describing inequalities in ways that makes addressing them more achievable.
- An understanding of how the knots interact to create systemic unequal impacts.
We are also gathering evidence from public engagement through lived experience research and a case study exploring a particular data-driven technology in health.
This is ongoing work as part of the Health Foundation and Ada Lovelace Institute partnership, and is expected to be reported in summer 2023. Together with other research in this programme, we will describe how data-driven systems interact with inequalities in health, and provide ways in which we might start to address those interactions to design systems that can reduce negative outcomes.
Methodology
This review is a desk-based scoping exercise of publicly available documents, additional information shared by technology organisations. It was supplemented by stakeholder interviews and conducted in two concurrent steps. First was a document analysis of publicly available information on a selection of technologies:
- OpenSAFELY
- Genomics England and GenoMICC
- NHS Covid Dashboard (covering information on Q-Covid Algorithm and Shielded Patient List),
- NHS Digital and Public Health England – COVID-19 dashboard and Early Warning Systems
- Dr Doctor
- Babylon Health – COVID-19 Care Assistant, Ask A&E and GP at Hand.
These initial technologies were based on whether the technologies presented something novel or new, how they were used to manage the pandemic, and finally chosen for those with the widest national coverage in implementation.91
Using them as baseline opened up discussion with stakeholders to other data-related and data-driven interventions or technologies including stay-at home orders and local use of risk scoring algorithms.
Wherever possible, study documentation was selected according to the topics being addressed, and included technology and demographic coverage, data linkage, data quality and data availability as they related to inequalities. This was supplemented by any internal documents shared by stakeholders on those systems.
Data collection and analysis
Through convenience, purposive and snowball sampling (where broadly, interviewees were invited according to their direct involvement in a technology, using internal Ada Lovelace networks, or suggested by stakeholders themselves), stakeholders representing each of the systems were sought and invited for a web-based semi-structured interview. Further invitations were made to those experts using the systems, or involved in deploying interventions emerging from the use of those systems, with a total of 36 stakeholders participating in discussions on a range of data-related issues, from across public health consultancy, data analytics, product owners, NHS Commissioners, local council and parliament. Where possible, with permission, discussions were recorded and transcripts auto-generated via Microsoft Teams. Some quotes have been edited for clarity. In all other cases, field-notes were taken during the discussions and reflective notes afterwards. A thematic analysis was carried out to explore the main concerns influencing the creation, design and deployment of data-driven systems, and any approaches to responding to concerns of inequalities.
A summary of the teams interviewed:
| Stakeholder category | Area of expertise |
| Researcher/user | Inequalities and COVID-19 |
| Data custodians and curators | Research, access and ethics |
| Public sector/local government (MP) | Science and technology |
| Public sector/local government (MP) | Social inequalities |
| Public sector/local government (MP) | Health and social inequalities |
| Public health, engineer, analyst | Health and social inequalities |
| Medical | Genomics |
| Private-public partnership | Hospital waiting lists and digital platforms |
| Private-public partnership | Digital health tech and platforms |
| Private-public partnership (Clinical providers) | Digital health tech and platforms and care provision |
| Private-public commissioning | Digital platforms and dashboards nationally |
| NHS | Clinical safety, NHS Digital |
| NHS | Product owner |
| Public sector/Government (Product owner, statistician, user experience) | Public health |
| Data curators | Public data |
| Public sector/local government/NHS/users (Scotland) | Public data, public health |
Teams had experience working on a variety of technologies, including: Babylon (COVID-19 apps and GP at Hand); Dr Doctor; Genomics England (GenOMICC, Trusted Research Environment (TRE)); HDRUK data; NHS COVID-19 dashboard; OpenSAFELY TRE, Palantir; predictive analytics; Public Health England COVID-19 data dashboard; the Shielded Patients List; stay-at-home measures; and vulnerability scores/indexes.
Partner information and acknowledgements
The Ada Lovelace Institute and the Health Foundation are working in partnership to examine the interaction between data-driven systems and health and social inequalities, in the wake of the COVID-19 pandemic.
The partnership will explore how the accelerated adoption of data-driven technologies and systems during the pandemic may have affected inequalities.
Together we will generate an evidence base around the interaction between these technologies and health outcomes, building a shared understanding of the actions needed to reduce health inequalities and improve people’s health.
This paper was lead authored by Mavis Machirori, with substantive contributions from Anna Studman, Andrew Strait and Octavia Reeve. We are grateful to Mai Stafford and Josh Keith at the Health Foundation for their input into this report.
We would like thank the following colleagues who took part as interviewees or contributors to the project. This was through broad discussion of their work, the data ecosystem and what insights they had on the relationships to inequalities, or in reference to specific data-driven systems.
Alice Yu
Amir-Reza Mehrkar-Asl
Andy Snell
Andy Weaver
Anxo Roibas
Basil Jennings
Ben Holden
Chi Onwurah MP
Clare Griffiths
Ed Humpherson
Helen Stone
Hollydawn Murray
Ignacio Perez Pozuelo
Jessica Mai Sims
Jessica Morley
Joe Minton
Julie Anderson
Keith Grimes
Lisa Murphy
Marion Gibbon
Paola Quattroni
Richard Scott
Rohini Mathur
Tejal Patel
Tom Gallagher
Tom Whicher
- The King’s Fund. (2022). What are health inequalities? Available at: https://www.kingsfund.org.uk/publications/what-are-health-inequalities
- The King’s Fund. (2022).
- Department of Health and Social Care (DHSC). (2022). Data saves lives: reshaping health and social care with data. UK Government. Available at: https://www.gov.uk/government/publications/data-saves-lives-reshaping-health-and-social-care-with-data
- For a full list of the technologies this landscape review covered, please see the Case Studies.
- DHSC. (2022). Data saves lives: reshaping health and social care with data. UK Government. Available at: https://www.gov.uk/government/publications/data-saves-lives-reshaping-health-and-social-care-with-data
- This metaphor is attributed to a description provided by one of the research participants, on how data flowed in the design and implementation of their product. They described the processes from/to different directions and sources as full of ‘wibbles’, saying the systems involved and looked like ‘data spaghetti’, ‘data plumbing’, and ‘data pipelines’ with many players, on which more ‘spaghetti was being built’.
- United Nations Conference on Trade and Development (UNCTD). (2021). ‘Emerging technologies can foster an inclusive COVID-19 recovery’. unctad.org. Available at: https://unctad.org/news/emerging-technologies-can-foster-inclusive-COVID-19-recovery
- This is the current phrasing used for demarcating various levels at which care and interventions can be structured and deployed, according to the Department of Health and Social Care’s Policy Paper on Health and social care integration. See: Department of Health and Social Care. (2022). Health and social care integration: joining up care for people, places and populations. UK Government. Available at: https://www.gov.uk/government/publications/health-and-social-care-integration-joining-up-care-for-people-places-and-populations
- DHSC. (2022). Data saves lives: reshaping health and social care with data. UK Government. Available at: https://www.gov.uk/government/publications/data-saves-lives-reshaping-health-and-social-care-with-data
- BBC. ‘Covid: Priority shopping slot system in Wales scrapped’. BBC News. Available at: https://www.bbc.co.uk/news/uk-wales-politics-59505767
- DHSC. (2021). ‘Shielding programme ends for most vulnerable’. UK Government. Available at: https://www.gov.uk/government/news/shielding-programme-ends-for-most-vulnerable
- SCC. ‘Using AI to reduce waiting lists in hospitals’. SCC Insights. Available at: https://www.scc.com/insights/verticals/public-sector/healthcare/using-ai-to-reduce-waiting-lists-in-hospitals/
- Health Data Research UK. ‘Trusted Research Environments’. Available at: https://www.hdruk.ac.uk/access-to-health-data/trusted-research-environments/
- The Health Foundation (2022). The continuing impact of COVID-19 on health and inequalities. Available at: https://www.health.org.uk/publications/long-reads/the-continuing-impact-of-covid-19-on-health-and-inequalities
- Scientific Advisory Group for Emergencies. (2020). Drivers of the higher COVID-19 incidence, morbidity and mortality among minority ethnic groups, 23 September 2020. UK Government. Available at: https://www.gov.uk/government/publications/drivers-of-the-higher-covid-19-incidence-morbidity-and-mortality-among-minority-ethnic-groups-23-september-2020/drivers-of-the-higher-covid-19-incidence-morbidity-and-mortality-among-minority-ethnic-groups-23-september-2020–2
- Leslie, D., Mazumder, A., Peppin, A. et al. (2021). ‘Does “AI” stand for augmenting inequality in the era of COVID-19 healthcare?’. British Medical Journal, 372. Available at: https://www.bmj.com/content/372/bmj.n304
- Kickbusch, I., Piselli, D., Agrawal, A. et al. (2021). ‘The Lancet and Financial Times Commission on governing health futures 2030: growing up in a digital world’. The Lancet, 398 (10312), pp.1727-1776. Available at: https://www.thelancet.com/journals/lancet/article/PIIS0140-6736(21)01824-9/fulltext
- Nuffield Trust. The impact of COVID-19 on the use of digital technology in the NHS. Available at: https://www.nuffieldtrust.org.uk/files/2020-08/the-impact-of-covid-19-on-the-use-of-digital-technology-in-the-nhs-web-2.pdf
- DHSC. (2022). Data saves lives: reshaping health and social care with data. UK Government. Available at: https://www.gov.uk/government/publications/data-saves-lives-reshaping-health-and-social-care-with-data
- UK Statistics Authority. (2021). Inclusive Data Taskforce recommendations report: Leaving no one behind – How can we be more inclusive in our data?, section 5. Available at: https://uksa.statisticsauthority.gov.uk/publication/inclusive-data-taskforce-recommendations-report-leaving-no-one-behind-how-can-we-be-more-inclusive-in-our-data/pages/5/
- Ada Lovelace Institute. (2020). ‘Tackling health and social inequalities in data-driven systems’. Available at: https://www.adalovelaceinstitute.org/project/health-social-inequalities-data-driven-systems/
- The Health Foundation. (2020). Living in poverty was bad for your health long before COVID-19. Available at: https://www.health.org.uk/publications/long-reads/living-in-poverty-was-bad-for-your-health-long-before-COVID-19
- Public Health England (2020). Beyond the data: Understanding the impact of COVID-19 on BAME groups. UK Government. Available at: https://assets.publishing.service.gov.uk/government/uploads/system/uploads/attachment_data/file/892376/COVID_stakeholder_engagement_synthesis_beyond_the_data.pdf
- Nguyen, L.H., Drew, D.A., Graham, M.S. et al. (2020). ‘Risk of COVID-19 among front-line health-care workers and the general community: a prospective cohort study’. The Lancet, 5(9). Available at: https://www.thelancet.com/journals/lanpub/article/PIIS2468-2667(20)30164-X/fulltext
- Ada Lovelace Institute. (2021). The data divide. Available at: https://www.adalovelaceinstitute.org/survey/data-divide/
- A system does not always have a concrete starting point, and in the case of data-driven systems, the data flow included previously collated information, existing systems, new technologies and players – all of which had to respond to a public emergency. As such, our pipeline is not linear, and any stakeholder can enter the pipeline by their everyday activities: as data broker, product owner who decides what data can be used to build a system, an analyst with already existing data, statistician with incomplete data, a commissioner with limited resources to fund local or national pandemic responses. However, each decision made has an impact on the opening or closing of the pipeline.
- OpenSAFELY. ‘About OpenSAFELY’. Available at: https://www.opensafely.org/about/
- Genomics England. COVID-19 Study. Available at: https://www.genomicsengland.co.uk/initiatives/covid-19
- Genomics England. (2022). ‘Genetic study gives extensive insights into severe COVID-19’. Available at: https://www.genomicsengland.co.uk/news/study-insights-severe-covid-19
- Public Health England. ‘New surveillance system for early detection of COVID-19’. UK Government. Available at: https://www.gov.uk/government/news/new-surveillance-system-for-early-detection-of-covid-19
- NHS Digital. (2022). Shielded Patient List. Available at: https://digital.nhs.uk/coronavirus/shielded-patient-list
- NHS Digital. (2022). COVID-19 Clinical Risk Assessment Tool. Available at: https://digital.nhs.uk/coronavirus/risk-assessment/clinical-tool
- NHS England. Artificial Intelligence in Health and Care Award – Round 1 AI in Health and Care Awards. Available at: https://www.england.nhs.uk/aac/what-we-do/how-can-the-aac-help-me/ai-award/round-1/
- See: Dr Doctor: https://www.drdoctor.co.uk/
- See: Babylon Health: https://www.babylonhealth.com/en-gb
- Downey, A. (2020). ‘Third NHS trust signs deal with Babylon for digital triage’. Digital Health. Available at: https://www.digitalhealth.net/2020/05/third-nhs-trust-signs-deal-with-babylon-for-digital-triage/
- Babylon Health. (2020). ‘Babylon launches COVID-19 Care Assistant for the Coronavirus pandemic’. Available at: https://ir.babylonhealth.com/news-events/press-releases/detail/50/babylon-launches-covid-19-care-assistant-for-the
- UK Statistics Authority. (2020). Statistics for the public good. Available at: https://uksa.statisticsauthority.gov.uk/statistics-for-the-public-good/
- Taylor, R. (2020). ‘Using data for the public good’. The Royal Society. Available at: https://royalsociety.org/blog/2020/07/using-data-for-the-public-good/
- National Data Guardian. (2021). Putting Good into Practice: A public dialogue on making public benefit assessments when using health and care data. UK Government. Available at: https://assets.publishing.service.gov.uk/government/uploads/system/uploads/attachment_data/file/977737/PGiP_Report_FINAL_1304.pdf
- National Institute for Health and Care Excellence. (2019). Evidence standards framework for digital health technologies: user guide. Available at: https://www.nice.org.uk/corporate/ecd7/resources/evidence-standards-framework-for-digital-health-technologies-user-guide-pdf-11696158815685
- Tasioulas, J. (2021). ‘The role of the arts and humanities in thinking about artificial intelligence (AI)’. Ada Lovelace Institute. Available at: https://www.adalovelaceinstitute.org/blog/role-arts-humanities-thinking-artificial-intelligence-ai/
- For descriptions of statistical coverage by geographical boundaries, see: Office for National Statistics (ONS). (2016). Lower Layer Super Output Area (LSOA) boundaries. Available at: https://data.gov.uk/dataset/fa883558-22fb-4a1a-8529-cffdee47d500/lower-layer-super-output-area-lsoa-boundaries
- UK Statistics Authority. (2021). Inclusive Data Taskforce recommendations report: Leaving no one behind – How can we be more inclusive in our data? Available at: https://uksa.statisticsauthority.gov.uk/publication/inclusive-data-taskforce-recommendations-report-leaving-no-one-behind-how-can-we-be-more-inclusive-in-our-data/
- Ada Lovelace Institute. (2020). Black data matters: how missing data undermines equitable societies [Webinar]. Available at: https://www.adalovelaceinstitute.org/event/black-data-matters-how-missing-data-undermines-equitable-societies/
- Sirugo, G., Williams, S.M. and Tishkoff, S.A. (2019). ‘The Missing Diversity in Human Genetic Studies’. Cell, 177(1), pp. 26–31. Available at: https://www.cell.com/fulltext/S0092-8674(19)30231-4
- Nuffield Trust. (2021). Ethnicity coding in English health service datasets. Available at: https://www.nuffieldtrust.org.uk/research/ethnicity-coding-in-english-health-service-datasets
- Nuffield Trust. (2021).
- Providers of clinical software used in primary care for management of patient records
- Index of Multiple Deprivation
- Curtis, H. J., Inglesby, P., Morton, C. E. et al. (2021). ‘Trends and clinical characteristics of COVID-19 vaccine recipients: a federated analysis of 57.9 million patients’ primary care records in situ using OpenSAFELY’. medRxiv. Available at: https://www.medrxiv.org/content/10.1101/2021.01.25.21250356v3
- NHS England. (2020). COVID-19 Hospital Activity. Available at: https://www.england.nhs.uk/statistics/statistical-work-areas/covid-19-hospital-activity/
- Greater London Authority. (2020). Coronavirus (COVID-19) Weekly Update. Available at: https://data.london.gov.uk/dataset/coronavirus–covid-19–cases
- Hodgson, K. and Peytrignet, S. (2021). ‘Who was advised to shield from COVID-19?’. The Health Foundation. Available at: https://www.health.org.uk/news-and-comment/charts-and-infographics/exploring-demographic-variation-in-groups-advised-to-shield
- ONS. (2018). Inequalities data audit: focus on ethnicity. Available at: https://www.ons.gov.uk/methodology/methodologicalpublications/generalmethodology/onsworkingpaperseries/inequalitiesdataauditfocusonethnicity
- DrDoctor. ‘What is DrDoctor?’. Available at: https://www.drdoctor.co.uk/for-patients
- DrDoctor. ‘Customer stories’. Available at: https://www.drdoctor.co.uk/customer-stories
- Crouch, H. (2020). ‘DrDoctor CEO has high hopes for post-Covid innovation’. Digital Health News. Available at: https://www.digitalhealth.net/2020/07/drdoctor-ceo-has-high-hopes-for-post-covid-innovation/
- Zini, M. L. L. and Banfi, G. (2021). ‘A Narrative Literature Review of Bias in Collecting Patient Reported Outcomes Measures (PROMs)’. International Journal of Environmental Research and Public Health, 18(23). Available at: https://www.mdpi.com/1660-4601/18/23/12445/htm
- Ada Lovelace Institute. (2021). The data divide. Available at: https://www.adalovelaceinstitute.org/report/the-data-divide/
- Sieck, C. J., Sheon, A., Ancker, J. S. et al. (2021). ‘Digital inclusion as a social determinant of health’. Nature. Available at: https://www.nature.com/articles/s41746-021-00413-8
- Marmott, M. (2022). ‘Studying health inequalities has been my life’s work. What’s about to happen in the UK is unprecedented’. The Guardian. Available at: https://www.theguardian.com/commentisfree/2022/apr/08/health-inequalities-uk-poverty-life-death
- NHS Digital. (2020). COPI notice to NHS Digital – 17 March 2020. Available at: https://digital.nhs.uk/coronavirus/coronavirus-covid-19-response-information-governance-hub/control-of-patient-information-copi-notice
- NHS England. (2014). ‘NHS England’s Chief Executive celebrates CCG’s achievements’. Available at: https://www.england.nhs.uk/ccgs/
- NHS England. What are integrated care systems? Available at: https://www.england.nhs.uk/integratedcare/what-is-integrated-care/
- DHSC. (2022). Data saves lives: reshaping health and social care with data. UK Government. Available at: https://www.gov.uk/government/publications/data-saves-lives-reshaping-health-and-social-care-with-data
- NHS England. What are integrated care systems? Available at: https://www.england.nhs.uk/integratedcare/what-is-integrated-care/
- UK Health Security Agency. (2022). The R value and growth rate. UK Government. Available at: https://www.gov.uk/guidance/the-r-value-and-growth-rate
- Ball, J. (2020). ‘The R-number – and the danger of false certainty’. The Spectator. Available at: https://www.spectator.co.uk/article/the-r-number-and-the-danger-of-false-certainty
- PA News Agency. (2020). ‘Local lockdowns cause for serious concern, Manchester and Liverpool mayors say’. The Yorkshire Press. Available at: https://www.yorkpress.co.uk/news/national/18501993.local-lockdowns-cause-serious-concern-manchester-liverpool-mayors-say/
- Source: World Economic Forum. (2020). 5 things COVID-19 has taught us about inequality. Available at: https://www.weforum.org/agenda/2020/08/5-things-covid-19-has-taught-us-about-inequality/
- Kelion, L. (2020). ‘Excel: Why using Microsoft’s tool caused COVID-19 results to be lost’. BBC News. Available at: https://www.bbc.co.uk/news/technology-54423988
- NHS England. NHS England’s privacy notice: OpenSAFELY – the Coronavirus (COVID-19) Research Platform. Available at: https://www.england.nhs.uk/contact-us/privacy-notice/how-we-use-your-information/covid-19-response/coronavirus-covid-19-research-platform/
- Curtis, H. J., Inglesby, P., Morton, C. E. et al. (2021). ‘Trends and clinical characteristics of COVID-19 vaccine recipients: a federated analysis of 57.9 million patients’ primary care records in situ using OpenSAFELY’. medRxiv. Available at: https://www.medrxiv.org/content/10.1101/2021.01.25.21250356v3
- NHS Digital. (2022). COVID-19 Population Risk Assessment – Missing or unknown data. Available at: https://digital.nhs.uk/coronavirus/risk-assessment/population#missing-or-unknown-data
- Merrifield, N. (2021). ‘Data lowdown: 1.7 million added to shielding list’. Pulse. Available at: https://www.pulsetoday.co.uk/analysis/coronavirus/data-lowdown-1-7-million-added-to-shielding-list/
- The Health Foundation. (2021). Assessing the impact of COVID-19 on the clinically extremely vulnerable population. https://www.health.org.uk/publications/reports/assessing-the-impact-of-covid-19-on-the-clinically-extremely-vulnerable-population
- Genomics England. Diverse Data. Available at: https://www.genomicsengland.co.uk/initiatives/diverse-data/background
- Zakrzewski, S. (2020). ‘No, “Racial Genetics” Aren’t Affecting COVID-19 Deaths’. Sapiens. Available at: https://www.sapiens.org/biology/covid-race-genetics/
- Haque, Z. (2020). ‘Why does COVID-19 affect ethnic minorities so badly? It isn’t to do with biology’. The Guardian. Available at: https://www.theguardian.com/commentisfree/2020/jun/22/covid-19-britain-ethnic-minorities-government-race-inequality-epidemic
- British Heart Foundation. (2021). Why are so many people from ethnic minority backgrounds dying during the pandemic?. Available at: https://www.bhf.org.uk/informationsupport/heart-matters-magazine/news/behind-the-headlines/coronavirus/coronavirus-and-ethnic-minorities
- Ipsos MORI. (2018). Evaluation of Babylon GP At Hand, progress report. Hammersmith and Fulham Clinical Commissioning Group. Available at: https://www.hammersmithfulhamccg.nhs.uk/media/143207/PCCC-Item-7-Evaluation-of-Babylon-GPaH-Progress-Report-December-2018.pdf
- NHS. (2021). NHS Patient Safety Strategy: 2021 update. Available at: https://www.england.nhs.uk/wp-content/uploads/2021/02/B0225-NHS-Patient-Safety-Strategy-update-Feb-2021-Final-v2.pdf
- Public Health England. Analytics tools. Office for Health Improvement and Disparities. Available at: https://analytics.phe.gov.uk/
- Public Health England. (2022). COVID-19 Health Inequalities Monitoring for England (CHIME) tool. Office for Health Improvement and Disparities. Available at: https://analytics.phe.gov.uk/apps/chime/
- Public Health England. (2022). Health Inequalities Dashboard. Office for Health Improvement and Disparities. Available at: https://analytics.phe.gov.uk/apps/health-inequalities-dashboard/
- Public Health England. (2022). Wider Impacts of COVID-19 on Health (WICH) monitoring tool. Office for Health Improvement and Disparities. Available at: https://analytics.phe.gov.uk/apps/covid-19-indirect-effects/
- The Q Community. (2022). ‘Moving past backlogs: how can a focus on data help to ensure equitable access to services? Call for participants’. The Health Foundation. Available at : https://q.health.org.uk/news-story/moving-past-backlogs-how-can-a-focus-on-data-help-to-ensure-equitable-access-to-services-call-for-participants/
- The Q Community. (2021). ‘Local system collaboration: implementing new pathways with Advice and Guidance and enhanced perioperative care.’ The Health Foundation. Available at: https://s20056.pcdn.co/wp-content/uploads/2021/11/5.-Local-system-collaboration.pdf
- DrDoctor. ‘Customer stories’. Available at: https://www.drdoctor.co.uk/customer-stories
- We thank Rachel Coldicutt’s initial mapping of pandemic technologies, in an internal commissioned report submitted to Ada Lovelace in the early part of 2021, which helped shape and solidify our approach to these case studies.
Related content

Don’t start with the data: a people-centred approach to addressing health inequalities
Why identities and experiences can’t be reduced to categories

The data divide
Public attitudes to tackling social and health inequalities in the COVID-19 pandemic and beyond